
PlotPulse Analytics
Crop tracking and analytics platform that lets growers log field data daily, compare seasons side by side, and spot performance shifts before they cost yield.
Client
PlotPulse
Duration
18 weeks
Key Result
Daily crop insight in one dashboard
Daily
Crop logging cadence
YoY
Season comparisons
Laravel
Application core
React
Analytics dashboard
Gallery
A closer look at the project
Project Overview
The Challenge & Opportunity
Growers and agronomy teams often track crop performance across notebooks, spreadsheets, and seasonal memory—making it hard to see what changed and why. PlotPulse Analytics gives farms a structured daily logging workflow and an interactive dashboard that surfaces trends against prior records, so teams can adjust irrigation, inputs, and fieldwork with clearer evidence.
Business Goals
- Enable fast daily crop data entry from the field or office
- Surface interactive dashboards for yield, health, and input performance
- Let users compare current season data against historical records
- Help teams identify anomalies and progress without spreadsheet hunting
- Support data-driven decisions for better crop management outcomes
Challenges
- Designing entry flows simple enough for daily use under field conditions
- Modeling diverse crop types, plots, and seasonal timelines in one schema
- Building comparison views that stay readable across years of records
- Keeping dashboards responsive as historical datasets grow
- Balancing agronomic detail with a UI non-technical users can trust
Our Solution
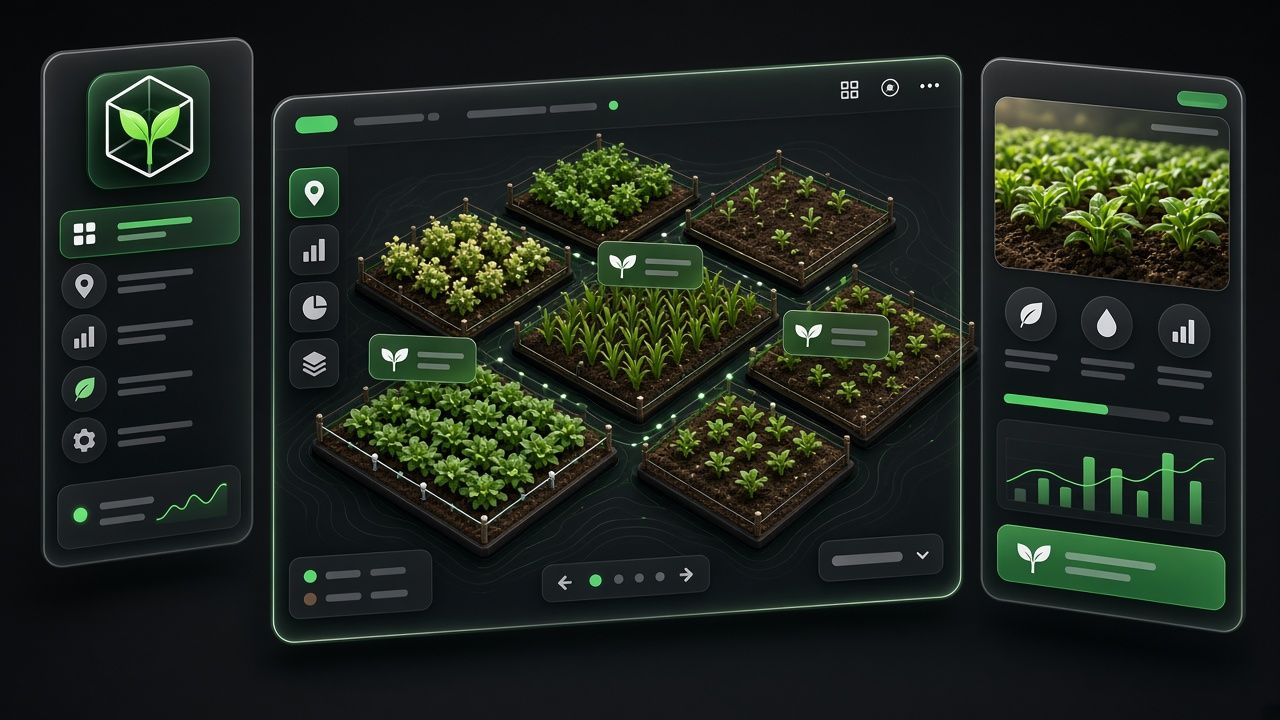
We delivered a Laravel and React SaaS platform with a PostgreSQL data layer optimized for time-series crop logs and plot-level history. Growers capture daily observations and metrics through streamlined forms, while Chart.js-powered dashboards visualize performance and season-over-season comparisons. Redis caching keeps analytics snappy, and CI/CD pipelines support iterative releases as new crop modules and report types roll out.
Tech Stack
Technologies Used
Features
What We Built
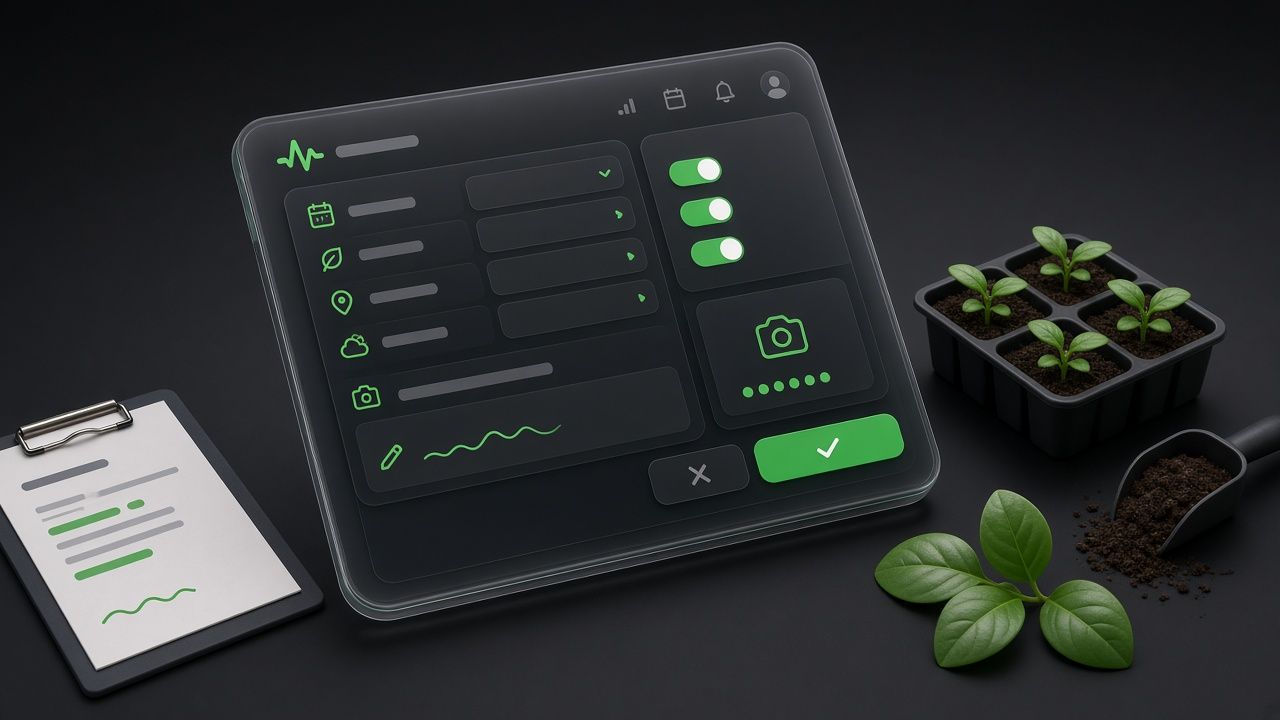
Daily crop logging for plots, varieties, and field observations
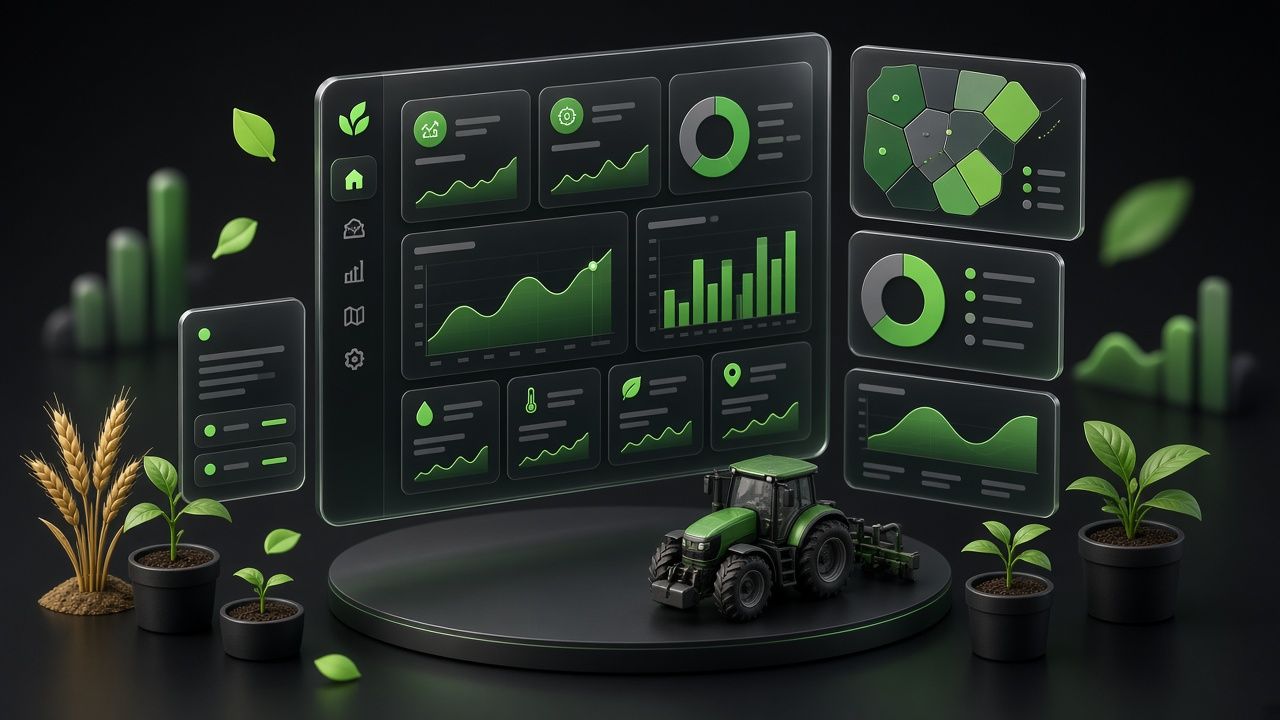
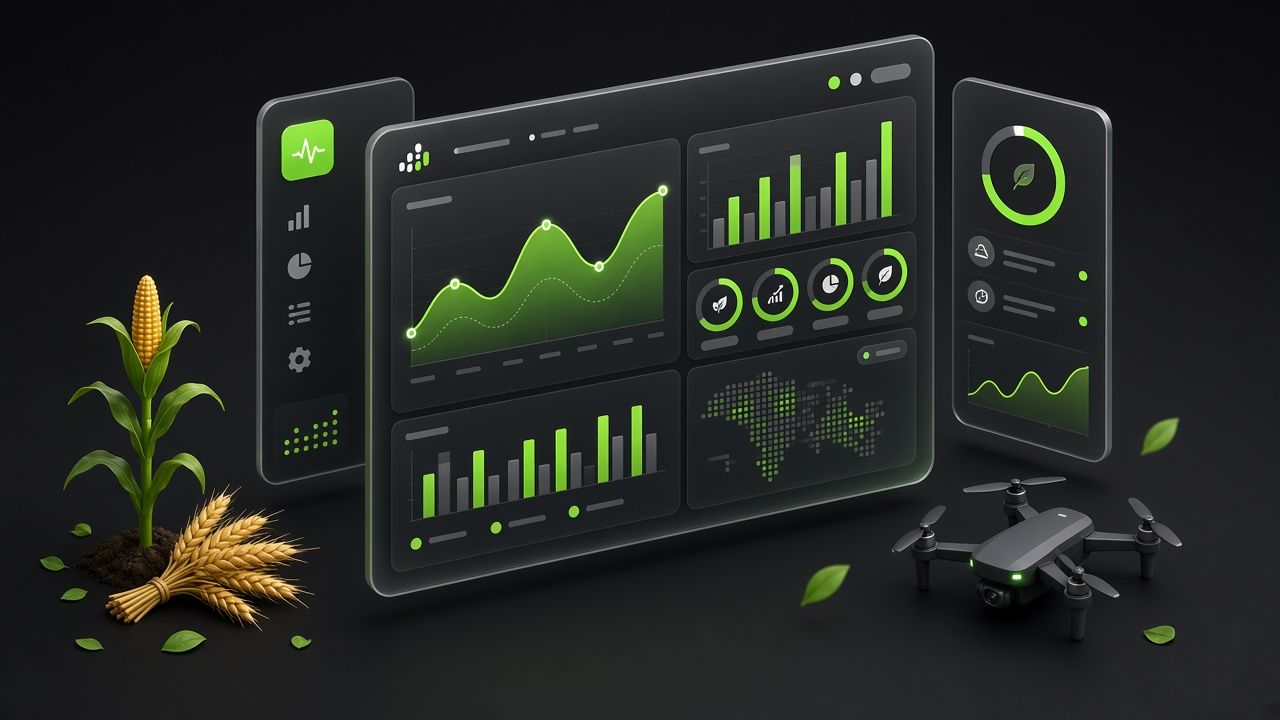
Interactive performance dashboard with filterable charts
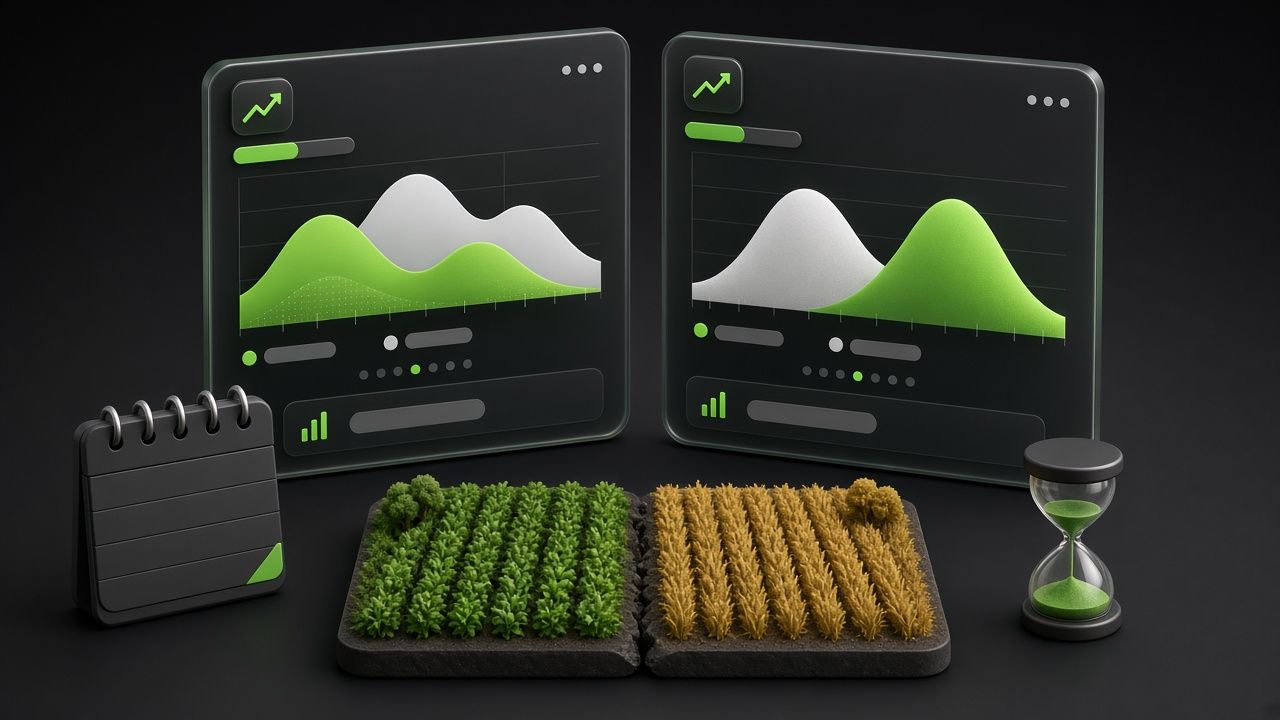
Season-over-season and prior-period comparison views
Plot and crop profile management with historical timelines
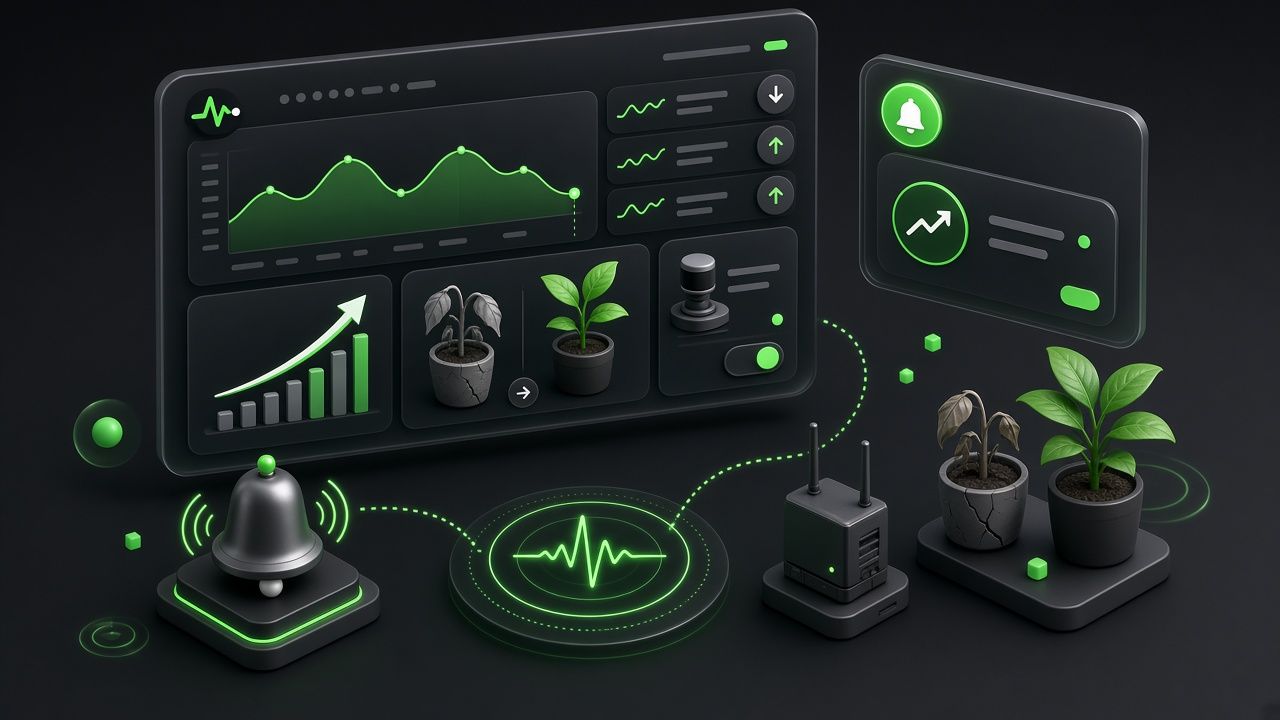
Trend alerts for sudden drops or gains in key metrics
Exportable summaries for agronomists and farm managers
Role-based access for owners, field staff, and advisors
Process
How We Delivered
Discovery
Interviewed growers and agronomy advisors to map daily logging habits and decision points.
Data Model
Designed plot, crop, and seasonal record structures for flexible comparison and reporting.
Development
Built Laravel APIs, React dashboards, and Chart.js analytics modules in agile sprints.
Validation
Tested entry speed and comparison clarity with pilot farms across multiple crop types.
Launch
Rolled out to early customers, monitored usage patterns, and refined dashboard defaults.
Outcomes
Results That Matter
- Growers replaced fragmented notebooks and spreadsheets with a single crop history hub.
- Season comparisons made performance shifts visible earlier in the growing cycle.
- Teams used dashboard trends to adjust inputs and fieldwork with clearer confidence.
“PlotPulse Analytics finally put our daily field notes and last season’s numbers in one place. We spot issues weeks earlier than we used to.”
Elena Vargas
Farm Operations Manager, Greenridge Cooperative
Ready to start your project?
Let’s discuss how we can help you achieve similar results.
Discuss Your Project